


TeamRX8
December 17, 2020
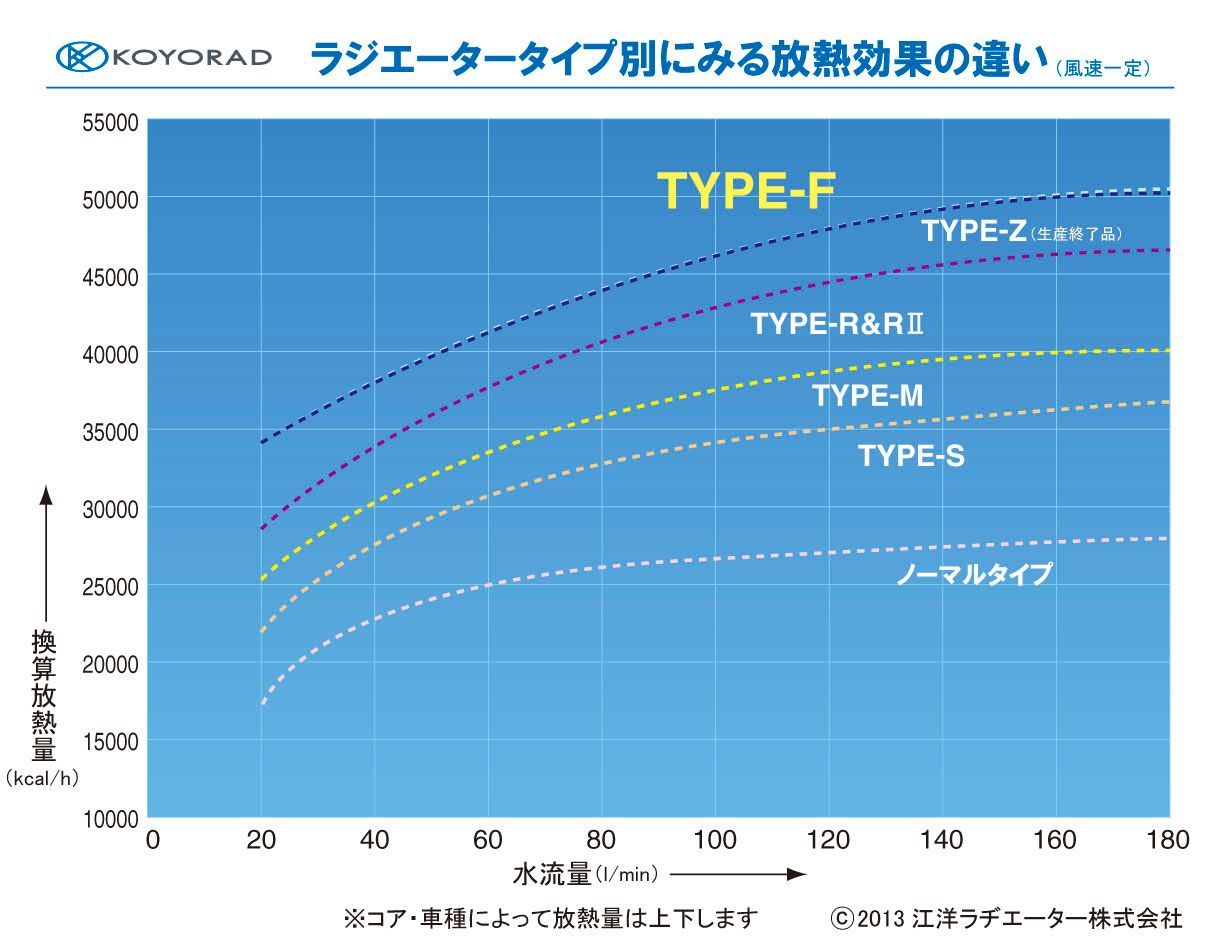
In the graph above, the water flow rate on the horizontal axis can be seen as an increase in engine speed, and the vertical axis can be seen as the cooling performance at that time. As far as you can see in this graph, the heat dissipation effect is higher in the order of TYPE-S, M, R & RII, F = Z. The more power you power up, the higher the heat dissipation effect required by the engine, and the same is true for vehicles that ride in situations where the WOT time is long.
.
More About This Picture
Vehicle
N/A
Location
N/A
Keywords
N/A
Discover More Pictures
See More


Advertisement
Be the first to comment on this picture!