Semi-Auto MAF Scaling with excel! copy and paste!
 06-30-2013, 01:36 PM
#51

Some have three tables, some have two - depends on the year. 04-05 have three Gears 1-2,3-4,5-6 and 06 an up have Gears 1-3 and 4-6.
Also, injector scales throw off the tune - not just the MAF, and the VE table does smooth out the ports opening among other things. You also have a calculated load max, IAT and ECT modifications. There are at least 6 tables that impact the tune so it is a bit complicated for excel in my humble opinion.
Also, injector scales throw off the tune - not just the MAF, and the VE table does smooth out the ports opening among other things. You also have a calculated load max, IAT and ECT modifications. There are at least 6 tables that impact the tune so it is a bit complicated for excel in my humble opinion.
 06-30-2013, 03:23 PM
#52
Good Morning Gremlin!
Thread Starter
iTrader: (2)

Join Date: May 2009
Location: Petawawa and Ottawa
Posts: 218
Likes: 0
Received 0 Likes
on
0 Posts
I got time, but thats strange I have an 05 MT and your right, it has 3 tables for open loop A/F but for closed it only has 2... O.o
I'm still trying to figure out how those tables come into play really, and at the moment I don't know if I will touch injectors, seems mine aren't messing with anything ATM
I'm still trying to figure out how those tables come into play really, and at the moment I don't know if I will touch injectors, seems mine aren't messing with anything ATM
07-01-2013, 04:20 PM
#53


Ok Here is the copy of what I got..
I did about 4 data logs.. All cruse from ranges of 3500-4500 I copied the DL's in to the MAF Calibration workbook and this is what I got on the maf adjustment Sheet1.. I was wondering if I did anything wrong. and why do the green Difference graph looks the way it does.. The adjusted from the stock maf looks good but other than that I just want to make sure im doing this correctly.. Thanks.
07-02-2013, 05:07 AM
#54
Good Morning Gremlin!
Thread Starter
iTrader: (2)
Join Date: May 2009
Location: Petawawa and Ottawa
Posts: 218
Likes: 0
Received 0 Likes
on
0 Posts
so the second axis, on the right is the one for difference, it just looks like your trims are negative, roughly -10 to -15 with the one spike at -20.. looks fine, but your whole MAF scale is probably going to be negative trims. looks like your doing it right
07-02-2013, 09:43 AM
#56
Ok Thanks Brandonien that is what I kinda figured just wanted to be sure about that... I do see that my adjustments are all in the negative ranges from stock but its kinda strange to me because I have an AEM cold air intake so i figured i would need to add more G/sec. But my graph is trending in the - ranges so I guess that is ok..
Kane. I have not accounted for AFR Latency and throttle tip in. From my understanding of the two and i could be wrong so slap my knuckles with your ruler and educate me if I am..
Throttle Tip in deals more with fuel enrichment on a sudden stab of the throttle from almost closed to 100% open. The air will flow faster than the fuel so you will need to inject extra fuel to keep up with the rush of air.
and AFR Latency is the period of time the O2 sensor takes its readings after the combustion takes place.. I think?
I am just trying to adjust cruse Maf scale.. wouldn't I take AFR Latency and Throttle tip in into account when i do WOT adjustments? Or is that something I should consider now?
Thank You
for your help.
07-02-2013, 10:50 AM
#57
Good Morning Gremlin!
Thread Starter
iTrader: (2)
Join Date: May 2009
Location: Petawawa and Ottawa
Posts: 218
Likes: 0
Received 0 Likes
on
0 Posts
well, I did leave my disclaimer of use at your own risk :P I haven't blown up yet though so thats gotta be a good sign!
I also have an AEM CAI and its got a negative trend
Kane, I'm currently trying to figure out the basics before I throw in the latency and other adds... I will try to get there though, I figured this is just a good method for a base tune atm
I also have an AEM CAI and its got a negative trend
Kane, I'm currently trying to figure out the basics before I throw in the latency and other adds... I will try to get there though, I figured this is just a good method for a base tune atm
07-02-2013, 10:55 AM
#58

WreakLoosE, I think that's basically it. If the majority of your log is steady state, then I don't think you need to worry about it too much. If you are on and off the throttle quite a bit, then you might need to do something other than just plug all the numbers into this spreadsheet.
Rather than just tuning one part of the MAF table at the start, I would start by scaling the whole table by a fixed amount. You can use the logged LTFT or the average of your own log readings for that. Once your LTFT is close to zero, ie the average correction across all MAF voltages is close to zero, then start changing the curve.
Scaling the whole table by a fixed amount gives you some safety in that the way the ecu corrects using LTFT will still work the same way. If you just fix the 3500-4500 rpm cruise range, then you run the risk of the ECU making assumptions that other MAF readings are correct since it will gather LTFT data from this range and then apply it to other parts of the curve.
07-02-2013, 11:08 AM
#59
Good Morning Gremlin!
Thread Starter
iTrader: (2)
Join Date: May 2009
Location: Petawawa and Ottawa
Posts: 218
Likes: 0
Received 0 Likes
on
0 Posts
I agree, this is the latest tune I did using my spreadsheet, I started with the stock tune and after 2 goes my maf was down to this in the majority of its range, I took into consideration the fact that the top end start to go crazy and picked a safe % to drop the rest of the scale by... this is still very much a beta product and as its a personal project I'm choosing to share, may never be perfect... It will require some effort to sift through the charts and decide what to do, but I like having the charts to figure out what im doing
07-02-2013, 11:09 AM
#60
Good Morning Gremlin!
Thread Starter
iTrader: (2)
Join Date: May 2009
Location: Petawawa and Ottawa
Posts: 218
Likes: 0
Received 0 Likes
on
0 Posts
also I'm trying to find a way to deal with the latency issue, as its making the bumps in my chart from the valves opening a bitch to fix
07-03-2013, 11:21 AM
#61
Ok.. I did another adjustment to my MAF scale..
I started out here:

I did multiple Data Logs and after 4146 lines of Data at RPM's from:
1500
2000
3800
4300
4400
4800
5300
5800
6300
I got this Maf sale after I made the adjustments to the Sheet1 Row2.

I got my adjustments close to 0 within +/- 1%. After volt point 2.77 I just took out 6.6% from the stock maf through the rest of the scale.. My LTFT are -0.16 So i am wondering if I can take out about another 6% for the rest of the maf curve???
Here are my G/Sec. from Voltage 2.89-4.69
72.82 82.6522752 93.160896 104.4316608 116.4825024 129.3941184 143.2292736 158.0238336 173.8674624 190.8856896 209.2219776 228.7597632 249.3735168 271.2156672 286.5123456 302.4187392 310.6050624 318.9527808 327.4618944
Any Thoughts?
Last edited by WreakLoosE; 07-03-2013 at 11:23 AM.
07-03-2013, 11:53 AM
#62
Good Morning Gremlin!
Thread Starter
iTrader: (2)
Join Date: May 2009
Location: Petawawa and Ottawa
Posts: 218
Likes: 0
Received 0 Likes
on
0 Posts
well I can tell you as a fellow aem CAI owner (*take this with a grain of salt be because my exhaust is done to the ****...*) that it will be an exponential negative fuel trim...
you could adjust by 6% across the whole board for starts but I would get a decent 200000+ rows of data in WOT high rpm if you want to adjust it properly, after about 50000 rows it gets decently reliable in the high end but 200000 will give you good results
glad to see my spreadsheet worked so well!! ^_^
Last edited by Brandonien; 07-03-2013 at 12:30 PM. Reason: i think I found one of the few words the forum wont block! O_O hehehe...
07-03-2013, 01:10 PM
#63
Oh yea... sorry...My exhaust system is done too..
Got
Racing Beat "Style" header
Agency Power Duel Resonated High Flow Cat.
TurboXS exhaust system..
All 3" piping.
BHR Ignition
Light weight and Underdrive Crank Pulley.
AEM CAI
SS brake and clutch lines
Megan Racing Coilovers
245/35R19 Tires
and The Ocho is a Titanium Grey '05 RX-8 MT
Got
Racing Beat "Style" header
Agency Power Duel Resonated High Flow Cat.
TurboXS exhaust system..
All 3" piping.
BHR Ignition
Light weight and Underdrive Crank Pulley.
AEM CAI
SS brake and clutch lines
Megan Racing Coilovers
245/35R19 Tires
and The Ocho is a Titanium Grey '05 RX-8 MT
07-03-2013, 03:49 PM
#65
lol.. yep..
One question. Im going to do some WOT pulls today in the High RPM ranges... The method I us is just get it to about 5000 rpm then floor it and start logging until redline? And should I do WOT on the low end too. hold it at like 2000 rpm then WOT till red line? Or is there another way i should do my WOT loggs?
One question. Im going to do some WOT pulls today in the High RPM ranges... The method I us is just get it to about 5000 rpm then floor it and start logging until redline? And should I do WOT on the low end too. hold it at like 2000 rpm then WOT till red line? Or is there another way i should do my WOT loggs?
07-05-2013, 05:50 PM
#68
Brandonien I am loving your excel workbook...
I have been playing with this for over a week now with good results..
I am still logging and adjusting. I have only 12,451 Lines of data And still going but I have been keeping a history of my logs and adjustments and I added an Average G/Sec line.. I have noticed after enough logs I get a very nice Maf Curve Here is quick pick of what i have been getting.. This shows the average maf curves that have been taken from all of my Adjusted Maf history.. Its kind of nice to see how this is all coming together... I figure after enough logs have been taken and adjustments made My Final Maf Curve will be similar to the total Average maf curve. I could be wrong but it will be kind of interesting to find out. This may be a perfect world scenario but I am interested to see how it all plays out..
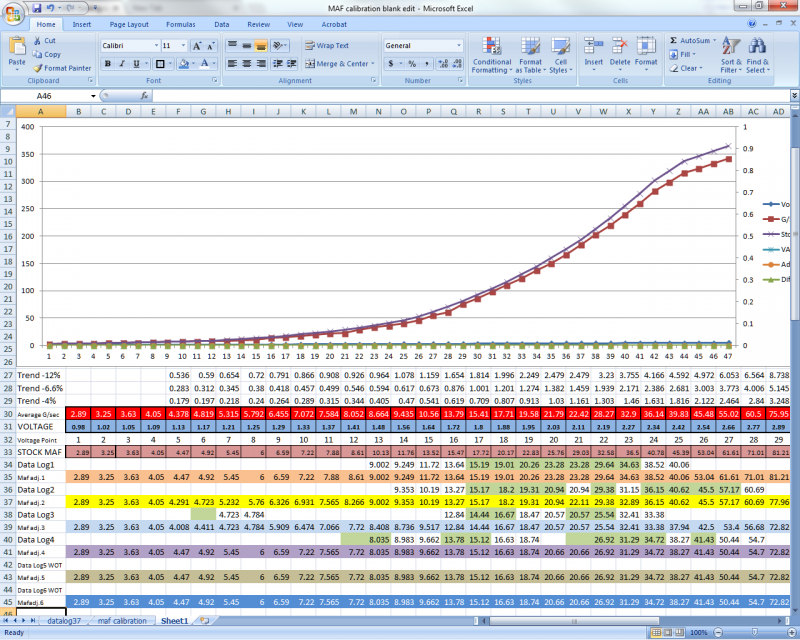
The first picture shows a Graph of the AVERAGE G/SEC compared to the Stock Maf.
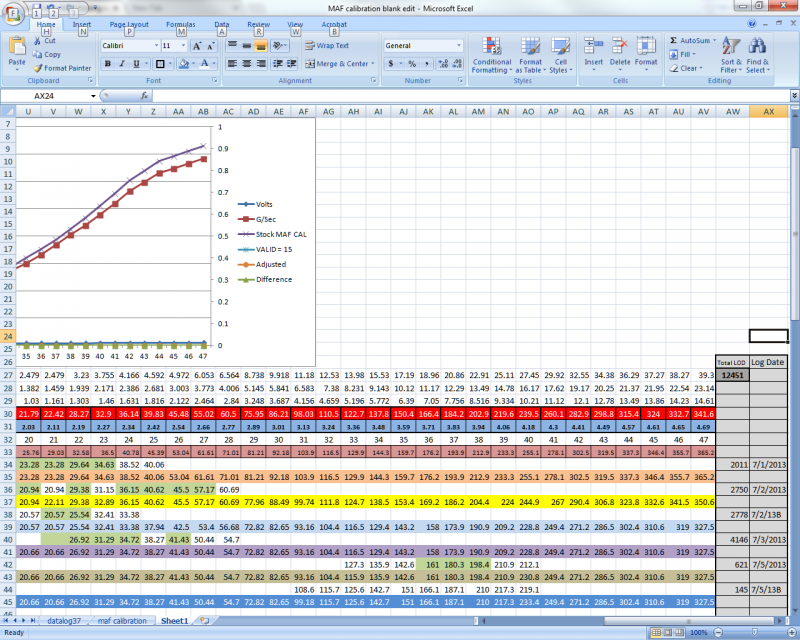
It also shows the Maf history starting from the Stock maf. Then Data log with G/sec changes made then My first Maf adjustment. And so on.. I have done 6 of them up until this point. I used some trending figures.. I have listed at the top of my history in some earlier Maf adjustments. But for the most part it was kept to stock on the lower and high end ranges. Then I started doing WOT pulls and getting a more clear picture on the higher end of the Maf Curve. The second picture just shows info for the higher end of the maf curve and a count of my Lines of data from the data logs i have done.. Just keeping a simple history like this really helps out with seeing how my particular Maf Calibration came about and now im seeing that it also can help with giving me some insight on where it is going... I am not running the AVERAGE Maf Curve I am currently using the Mafadj.6 line at the bottom in blue. Each time I do an data log it is off of the map curve I am running. This workbook is the shiznit..
I have been playing with this for over a week now with good results..
I am still logging and adjusting. I have only 12,451 Lines of data And still going but I have been keeping a history of my logs and adjustments and I added an Average G/Sec line.. I have noticed after enough logs I get a very nice Maf Curve Here is quick pick of what i have been getting.. This shows the average maf curves that have been taken from all of my Adjusted Maf history.. Its kind of nice to see how this is all coming together... I figure after enough logs have been taken and adjustments made My Final Maf Curve will be similar to the total Average maf curve. I could be wrong but it will be kind of interesting to find out. This may be a perfect world scenario but I am interested to see how it all plays out..


The first picture shows a Graph of the AVERAGE G/SEC compared to the Stock Maf.
It also shows the Maf history starting from the Stock maf. Then Data log with G/sec changes made then My first Maf adjustment. And so on.. I have done 6 of them up until this point. I used some trending figures.. I have listed at the top of my history in some earlier Maf adjustments. But for the most part it was kept to stock on the lower and high end ranges. Then I started doing WOT pulls and getting a more clear picture on the higher end of the Maf Curve. The second picture just shows info for the higher end of the maf curve and a count of my Lines of data from the data logs i have done.. Just keeping a simple history like this really helps out with seeing how my particular Maf Calibration came about and now im seeing that it also can help with giving me some insight on where it is going... I am not running the AVERAGE Maf Curve I am currently using the Mafadj.6 line at the bottom in blue. Each time I do an data log it is off of the map curve I am running. This workbook is the shiznit..
Last edited by WreakLoosE; 07-05-2013 at 05:56 PM.
07-10-2013, 12:09 PM
#70
Is there any way to get into the Higher Maf scale range like 4.3v and higher... Also what about the lower ones like .98-105v? Or do i need to worry about voltage points at the high and low ends? Just scale those according to the trend on my overall maf scal?
07-15-2013, 10:28 AM
#72
Just don't change the first cell in the table (the lowest voltage entry), or you will get a CEL. Aside from that, I have scaled the rest of the values according to the trend.
