When you click on links to various merchants on this site and make a purchase, this can result in this site earning a commission. Affiliate programs and affiliations include, but are not limited to, the eBay Partner Network.
Some stats from my road trip. It was a bit hilly in areas.
Depart 160.9 miles 8.963 gallons 17.951 mpg 77F ambient 195F coolant
Return 169.8 miles 9.263 gallons 18.330 mpg 90F ambient 200F coolant
Total 329.8 miles 18.226 gallons 18.095 mpg
This was with the A/C on during the trip.
Gotta agree with Brett looks nearly identical to the coolant temps I see highway cruising. This summer I have been monitoring my ECT temps closely and depending on ambient I've been seeing 194-203F; more typically with my AC off though.
So today I went on another road trip and got slightly better mpg. It was a different route than the last trip, but the conditions were mostly the same. Ambient was in the 75F range when I left and 88F when I returned. Coolant temps were typically around 185F in the morning and typically 195F coming back. This path was also somewhat hilly, as was the other. A/C on pretty much the whole time. The one major difference was average speed. The last trip my average speed was 75mph while this trip it was 65mph, due to different speed limit. I started on a full tank and went 236.2 miles (still had a 1/4 tank) and filled up after with 11.927 gallons, total mpg = 19.8. Not too shabby
If those figures are right, seems like you've got a leak somewhere.
Got any 2nd gear 13psi logs to post as comparison? This is also with WI and I am not adding any timing or anything to really take advantage of it, so I think it is actually reducing power some. But all I wanted it for was det suppression
I'll get some 3rd gear logs soon, they should look a bit mo' betta
Agreed. I only do them to get a quick baseline without going far from the house. I'm lazy haha. I've got to drive a bit tomorrow so I'll try to get a 3rd gear log or two.
Yeah that'd be an interesting comparison. My VD figures are out, could you post your VD settings?
Agreed 2nd gear never flows as much air, just thought it'd be closer to 300 up top compared with previous figures from your turbo.
Edited with correct VD settings:
Here's a 2nd gear WOT pull to compare. On the flat, 10.5psi dropping to 8.5psi at redline. Greddy hybrid, similar to GTX3576, but with the very small T25 turbine housing with iWG.
Last edited by JimmyBlack; 09-01-2016 at 02:51 AM.
Here's my 12psi WOT pull in 2nd gear on the flat, with VD presets show. I may be tracking too many parameters though, as some of my logs don't show consistently incrementing RPMs even in 3rd gear pulls. I'm running the Greddy hybrid, similar to GTX3576, but with the very small T25 turbine housing.
Final drive ratio should be 4.44 and no correction should be used .....
Updated above post using a log I took on the way home tonight. "Trim RPM by" figure seems to adjust the curve quite a lot. I just chose 100 because other values produced odd-shaped curves that just didn't look right.
Last edited by JimmyBlack; 09-01-2016 at 02:54 AM.
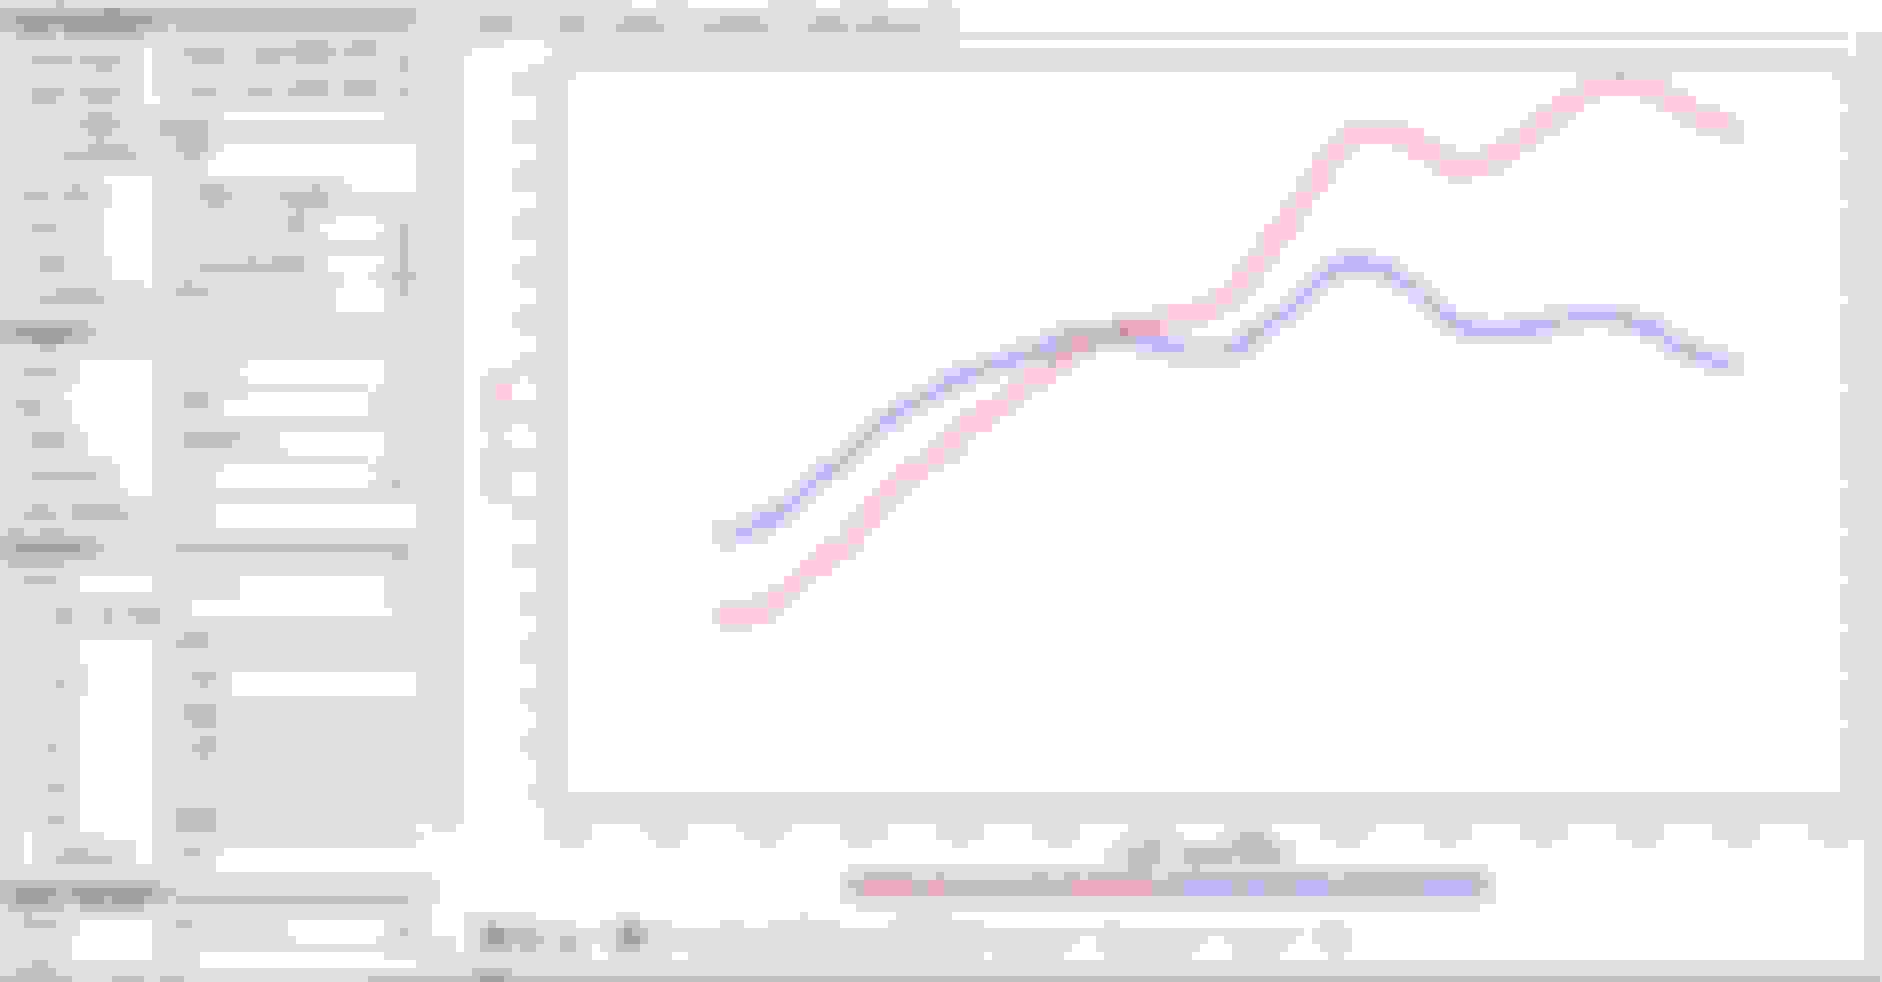
JB- Appreciate you sharing your screen shot. I think my logs look particularly unflattering due to the settings I am using. Here is the second log I posted in VD earlier, which showed 252 hp in VD, but in LogViewer with settings to match your original LV post now shows 419 hp:
The same log with my settings in LV drops it back down to 236:
The settings between and even within each of these applications can really swing the output one way or the other. My previous 2'nd gear logs probably looked much better for a couple reasons:
1) They were at 17psi
2) I typically lost traction in 2'nd gear so RPM shot straight up
I think it is important to understand that I don't use any of these dyno software applications to determine absolute hp numbers. As we can see none of them can be trusted, especially when our settings are not necessarily correct... I don't claim to have all my settings correct by any means. GIGO as they say Rather, I use them to look at relative changes between tune modifications that I make. I personally like VD for this because it plots out the AFR, Load and HP all on one screen. Wish I could add timing to that as well. I know ME/LV can display all those graphs together, with the exception the HP graph. For me this is important because I look at all of them to see where characteristics of each might be impacting the relative power output.
Updated above post using a log I took on the way home tonight. "Trim RPM by" figure seems to adjust the curve quite a lot. I just chose 100 because other values produced odd-shaped curves that just didn't look right.
Mine was on 100 .....have never touched that parameter .
I think if your logs look like that you just ignore them and try again . That wavey line can be caused by a few things . Uneven road surface , breaking traction , or just the pc missing a couple of readings .
I have a log done before my last dyno , V/D numbers were within a couple of % of the actual dyno all the way .
But , yeah , they can also be thrown way out by a lot of things . I've learned that if your V/D settings are correct and you consistently get the same numbers , you can pretty much say that is where you power level is at .
 08-29-2016, 03:52 PM