Dyno Results Compilation


 11-19-2006, 05:43 PM
#154

like the under the curve work going on. keep it balanced--i hate peaky engines you still running the knock sensor correct--havn't gone that crazy --right? nice tuning work.
I have forgotten --you do run synthetic oil dont ya? 5W/20 or have you seen the light?
olddragger
you still running the knock sensor correct--havn't gone that crazy --right? nice tuning work.I have forgotten --you do run synthetic oil dont ya? 5W/20 or have you seen the light?
olddragger
11-20-2006, 08:22 AM
#156
Registered

Join Date: Aug 2004
Posts: 170
Likes: 0
Received 0 Likes
on
0 Posts
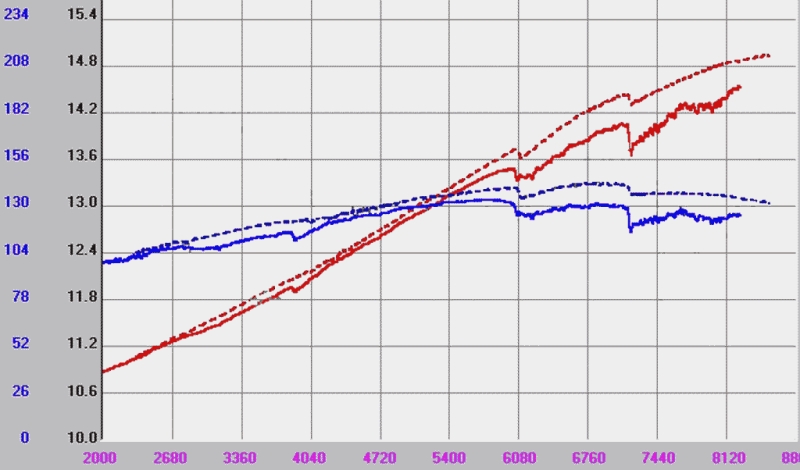
Set of DynoJet drf data files for six runs, one each in 2nd, 3rd & 4th gears. Sept 28th, 2004 runs were made with the stock OEM flywheel in the car; two days latter the Sept 30th runs were made with a RacingBeat Light Weight Flywheel (LWF) installed.
The runs can be opened and viewed with DynaJets RunViewer available at:
http://www.dynojet.com/downloads/software.aspx
Be sure set up the run screen by selecting the dual graph on the top left and then pull down on the upper left hand side of the graph where it says "none" to power do the same on the right of the upper graph for torque. The lower left should have Air/fuel selected. That�s all there is to it. The software allows for toggling displays &/or adjustments for SAE (corrected for altitude, temperature & humidity) to raw uncorrected, and several standards inbetween. I don't know if this version of the software has been adjusted to, or for the "new" SAE standard now being used which would result in lower peak power numbers being displayed. I suspect that it has not. FWIW these runs were made at some altitude (@ 5,300' more or less) on a fairly balmy day (@ 70 degress F IIRC), and its is always relatively dry here in Colorado. The actual temp/barometric pressure (i,e altitude) & humidity figures shoulds be in the drf files and, as I recall, can be toggeled to be displayed.
A nice feature of the viewer software allows the drf files from the same, or different cars to be loaded directly on top of one another for comparison purposes. For example, I see that earlier in this thread Spin9k has a posted a dyno chart from a dynojet dyno showing pulls in two different gears. If he were to change the x-axis display from "speed" to engine rpm, the graphs would overlay one another.
Cheers
Last edited by mlx8; 11-20-2006 at 09:10 AM.
11-29-2006, 01:28 AM
#157
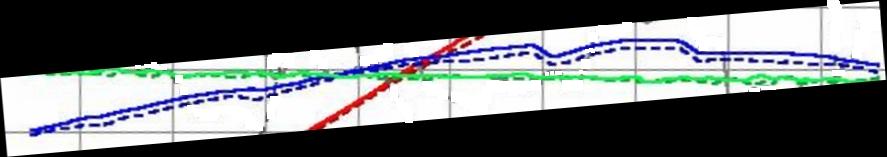
ok, the long awaited results graph, this is a factory stock 2005 RX-8 (solid) vs my flashed 2005 STU-modded car (dashed), rear wheel output run on the same Mustang dyno
EDIT: Summary of mods; custom intake box/filter, full custom exhaust WITH cat converter, AC delete, race pulley set, performance software flash, aftermarket ignition wires, the rest is OE/M
EDIT: Summary of mods; custom intake box/filter, full custom exhaust WITH cat converter, AC delete, race pulley set, performance software flash, aftermarket ignition wires, the rest is OE/M
Last edited by TeamRX8; 01-08-2007 at 02:45 PM.
 11-29-2006, 04:38 PM
#159
Lasse wankel

Join Date: Aug 2006
Location: Stockholm,Sweden
Posts: 164
Likes: 0
Received 0 Likes
on
0 Posts
My friend has a 04 RX-8 that we dynoed today on a RotoTest hub dyno. Engine set up was: stock block 25 000 km HKS air filter w/duct. Unorthodox pulleys alu flywheel 3" exhaust w/ no cat 2 rear silencers 3" and of course Shell V-Power 99 octane fuel. The result was 207 hp at hub which should be 227-231 hp@8000 rpm at flywheel at static mode. I could not dyno any higher in rpm becausse the rew limiter kicked in. Next will be RE Amemiya header.
/Lasse
/Lasse


 04-26-2007, 09:38 PM
#173
Registered User

Join Date: Apr 2007
Location: Fayettenam, NC
Posts: 25
Likes: 0
Received 0 Likes
on
0 Posts
I know that this is going to sound retarted. lol but I thought the mt rx-8 had like 235HP and the at like 210. I am just going off what the mazda wbesite said. This is a noob questin but I am confused.
04-27-2007, 12:10 AM
#174
Originally Posted by RX82
I know that this is going to sound retarted. lol but I thought the mt rx-8 had like 235HP and the at like 210. I am just going off what the mazda wbesite said. This is a noob questin but I am confused.
Read Read Read
04-27-2007, 08:00 AM
#175
Originally Posted by RX82
I know that this is going to sound retarted. lol but I thought the mt rx-8 had like 235HP and the at like 210. I am just going off what the mazda wbesite said. This is a noob questin but I am confused.
While mazda's website claims 230 hp, the car actually makes between 170-190 hp. The same goes even for a "400" hp corvette - it only puts down 300something hp to the wheels.
The dyno charts on this thread are for whp (wheel horse power), the actual power you get. So if a car makes 270 on a dyno sheet here, you can add back the 10-20% losses to get a number that compares with the original power quoted by mazda - in this case somewhere around 330 hp.